Testing Visual Acuity in Children
Introduction:
There are many factors that you must consider when picking the appropriate visual acuity test for children. Firstly, you must take into account their age and where they might be in their visual development. You must also take into account any other general health issues which might impact the child’s concentration or ability to perform a test.
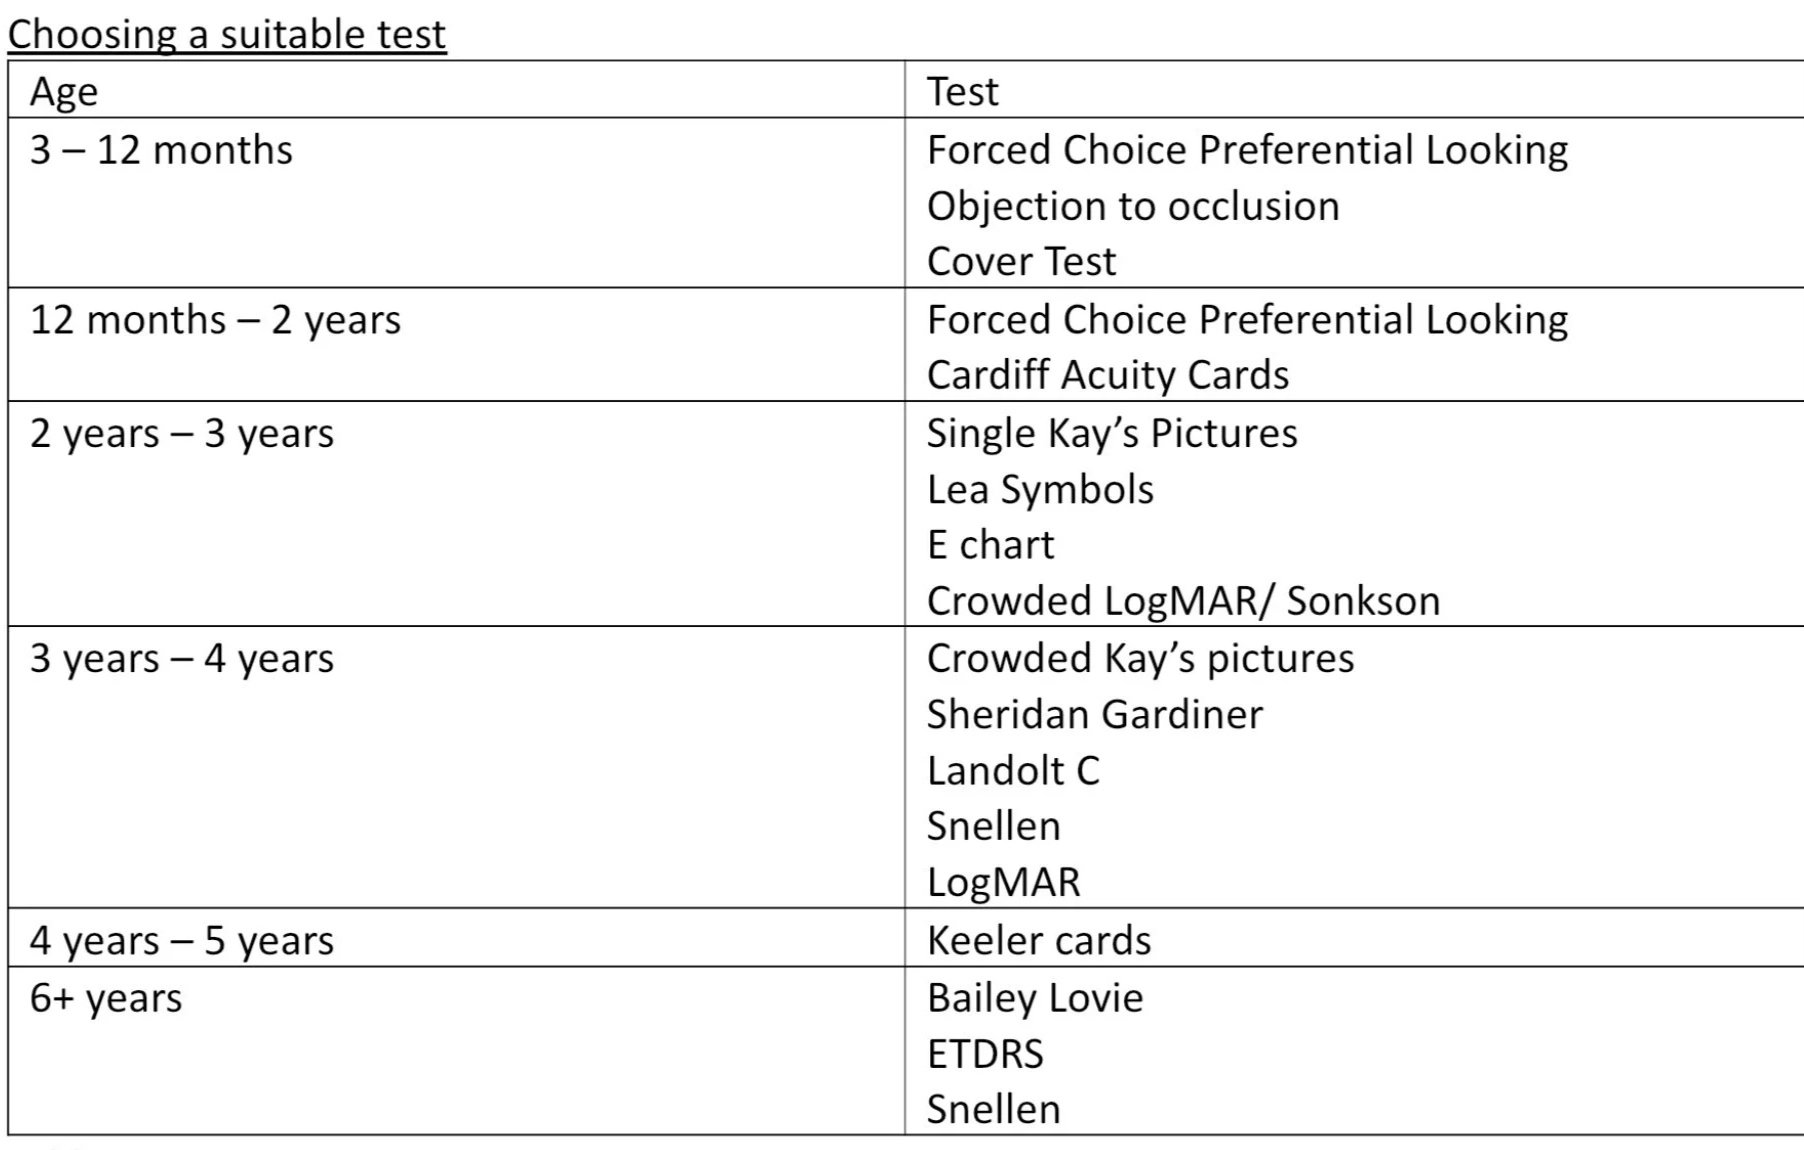
Table 1
Table 1 shows a rough outline of which tests are the most appropriate for different age ranges. Usually there is no harm in picking a more difficult visual acuity test and changing the option if it is not suitable. Always gauge your patient and pick what you think would be the most appropriate test for them.
Forced Choice Preferential Looking –
Theory:
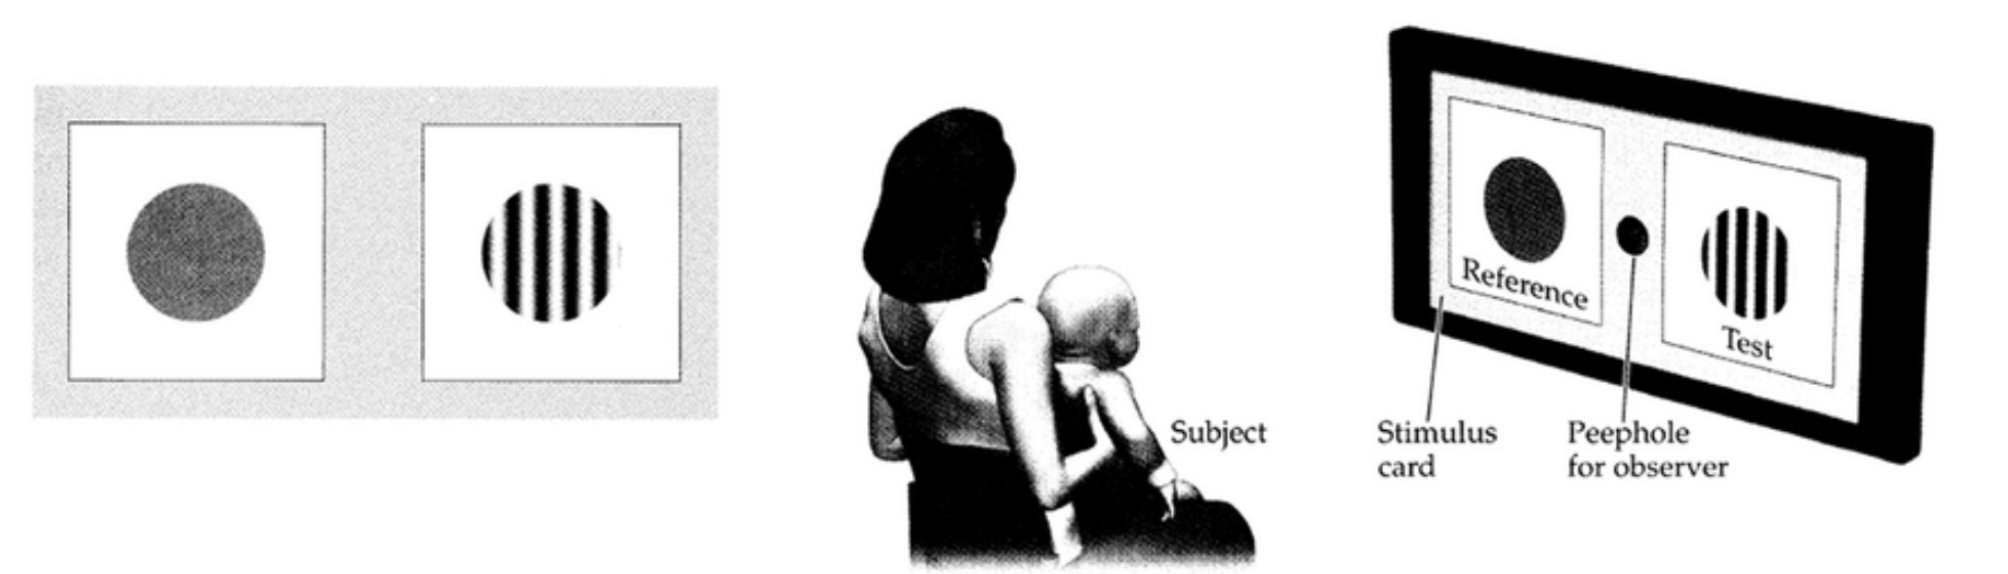
Preferential looking = Based on the theory that newborns and young children dislike stimuli that are boring and unchanging. So by presenting a stimulus where one side is plain and the other is a pattern, the baby will look towards the pattern.
Forced choice = the examiner has to decide which side the stimulus is on based on the reaction of the baby.
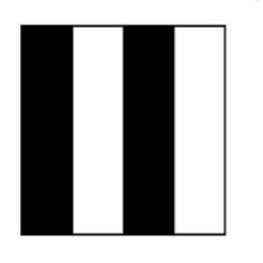
The test uses spatial frequency, measured in cycles per degree. 1 spatial degree is represented by 1 pair of black and white stripes. The narrower the stripes, the higher the spatial frequency.
Suitability:
This test is suitable for babies from approximately 6-8 weeks of age upwards. It can also be used in patients who have suffered strokes or other conditions which may impair speech and cognition.
Examination:
The infant is placed either in a chair or on their parent’s knee
The examiner sits 38cm or 55cm away from the child
The cards are held up in turn
The examiner places the card over their face, so that their eye is inline with the peephole
This allows the examiner to see the child’s eye
The examiner then determines where the grating/stimulus is depending on the child’s responses
You repeat the same card 3-4 times as you are aiming for at least 75% accuracy before moving on to the next card
The highest spatial frequency seen, is the VA threshold
30 c/deg = 6/6 Snellen = 0.00 LogMAR
3 c/deg = 6/60 Snellen = 1.00 LogMAR
Available tests:
Teeler Cards –
16 cards of a grey background with a square grating on one side
Distance: 38cm or 55cm. Place patient on parent’s knee
Range: 0.32 c/deg to 38 c/deg
.23 to 26.0 cpcm
16 Card Full Set Includes: 20/30, 20/40, 20/60, 20/80, 20/100, 20/150, 20/200, 20/300, 20/400, 20/600, 20/800, 20/1200, 20/1600, 20/2400, 20/3200 acuity, plus a blank and manual
Keeler Cards –
On one side a circular grating on the other a plain white circle
Distance: 38cm or 55cm
Range: 0.18 c/deg to 35 c/deg
Lea Gratings Paddles –
Theory:
Similar to the Keeler and Teller cards, the Lea Grating paddles use the principle of forced choice to detect the gratings. In contrast with the previous tests, the Lea Gratings use paddles instead of a card to present the choices. There is an option of 4 paddles with varying cycles corresponding with the grating acuity. There is a paddle in the set that is blank to use for contrast.
Suitability:
Children between 0 and 2 years of age
Examination:
The infant is placed either in a chair or on their parent’s knee
The examiner sits 57cm away from the child - If the child is too young, they might not respond to 57cm as they can’t see it so choose a suitable distance that is a multiple of 57cm (EG: 29cm, 43cm, 86cm)
The examiner holds the grating behind the blank paddle
The examiner moves the two paddles in opposite directions and watches the child’s eyes to see which direction they follow
Record which paddles the child responded to and at what distances.
Cardiff Acuity Cards
Theory:
Principle of vanishing optotypes = The pictures (duck, house, fish, car, train, boat and dog) are drawn with a white band bordered by 2 black bands half its width on a neutral background. Luminance of the picture is equal to that of the grey background. If the picture lies beyond the VA of the child – the picture blends in with the background and becomes invisible. VA of the child is the narrowest white band they can see.
Preferential looking = Based on the theory that newborns and young children dislike stimuli that are boring and unchanging. So by presenting a stimulus where one side is plain and the other is a pattern, the child will look towards the pattern.
Suitability:
Children aged 1-3 year olds as they tend to be uninterested in the black and white gratings, and are more interested in familiar pictures
Examination:
The infant is placed either in a chair or on their parent’s knee, one eye is occluded
The examiner sits 50cm or 1m away from the child
The cards are held up in turn
The examiner places the card next to their eye level, this allows the examiner to see the child’s eye
The examiner then determines where the stimulus is depending on the child’s responses
You repeat the same level 3 times using the different cards as you are aiming for 2 correct answers at each level before moving on to the next card
The level of VA is recorded as the last card the child was able to see
The VA is recorded in Snellen equivalent or LogMAR - however, this is an estimation as you are not testing the child’s ability to identify the acuity. Cardiff cards and other FCPL tests tend to overestimate visual acuity for this reason.
Kay pictures
Theory:
A LogMAR picture test based on the Bailey-Lovie chart construction where the number of optotypes on a line, the spacing between the optotypes and the size progression between each line is standardised
The new Kay Picture book has a each optotype on the line crowded compared to the previous version where only the line was crowded
The optotypes used are recognisable by children – duck, house, apple, van, star and boot
Suitability:
Children aged 2-3 years are able to perform recognition tasks through either naming or matching.
Examination:
The child is placed either in a chair or on their parent’s knee, one eye is occluded
The examiner stands 3m away from the child
Depending on the child, they are instructed to match or call out the image that is being pointed out
The level of VA is recorded as the smallest line the child is able to see
The VA is recorded in LogMAR - each picture is worth 0.02 LogMAR
At 3meteres the visual acuity range is 0.70 to -0.20 LogMAR
Alternative vision tests
Lea Symbols
Theory:
Based on the the same theory and calibration as the Landolt C, Snellen chart and LogMAR acuity.
There are 4 optotypes (house, square, circle, apple). The distance between the symbols is equal to the width of the symbols. From line to line the symbols decrease in size in 0.100 LogMAR steps.
Suitability:
Age: 2-4 years of age
Examination:
The child is placed either in a chair or on their parent’s knee, one eye is occluded
The examiner stands 3m away from the child
Depending on the child, they are instructed to match or call out the image that is being pointed out
The level of VA is recorded as the smallest line the child is able to see
At 3meteres the visual acuity range is 0.100LogMAR to 2.00LogMAR
Landolt C and E charts
Theory:
Uses 1 standardised optotype - the Landolt C or the Landolt E. The design is based on a grid, 5 units up and 5 units wide. The orientation of the optotype is changed and the patient is asked to identify where the gap is. The optotype is orientated with the gap either: up, down, left or right.
Suitability:
Patients not familiar with the alphabet
Examination:
The patient is placed 4m or 6m away from the chart (depending on the chart being used)
Their eye is occluded to test the vision monocularly
The patient is asked to point out which orientation the gap is facing - up, down, left, right
The level of vision is the lowest level the patient can correctly identify the orientation
Single Sheridan Gardiner
Based on the STYCAR vision test (which uses Snellen letters without the Serif font). Uses 7 letters - O, A, T, X, U, H, V. Tested at 6m but move closer if poor VA.
Suitability:
Children aged between 2 and 7. Now mainly used for patients with disabilities and those who do not share the same language as the examiner
Keeler LogMAR book
Theory:
Uses an equal number of LogMAR optotypes per line, with equal spacing between letters. It is a crowded test, with a bar surrounding the 4 letters presented at each level. The books cover a range of VA from 0.80 to -0.30 LogMAR. The letters used are Y, U, X, O, V, H.
Suitability:
Children who can read or match their letters
Examination:
The patient is placed 3m away from the examiner
Their eye is occluded to test the vision monocularly
The examiner uses 1 book per eye as to randomise the letters for each acuity level
The patient is asked to match or call out the letter that they are shown
The level of vision is the lowest level the patient can correctly identify the letters
Bailey Lovie
Theory:
The first LogMAR chart to be made widely available. It uses the 1968 British Standard letters (D, H, N, U, V, F, R, P, E, Z) and has 5 letters per row with letter size being equal to the spacing between letters and between rows.
Suitability:
All patients who are able to say or match their letters
Examination:
Patient is sat 6m away from the chart
Their eye is occluded to test the vision monocularly
The examiner asks the patient to read the lowest line that is clearest for them
Testing is continued until the patient is unable to correctly identify more than 2 letters per line
The level of vision is the lowest level the patient can correctly identify the letters
Repeat for the second eye
ETDRS
Theory:
Based on the LogMAR theory used to create the Bailey-Lovie chart. It uses Sloan Letters (C, D, H, K, N, O, R, S, V and Z) and is tested at 4m.
Suitability:
All patients who are able to say or match their letters
Examination:
Patient is sat 4m away from the chart
Their eye is occluded to test the vision monocularly
The examiner asks the patient to read the lowest line that is clearest for them
Testing is continued until the patient is unable to correctly identify more than 2 letters per line
The level of vision is the lowest level the patient can correctly identify the letters
Repeat for the second eye
Snellen chart
Theory:
Letters are drawn on a 5x5 unit grid. The letters used are C, D, E, F, L, O, P, T, Z. Unlike the LogMAR tests, the number of letters on each line on a Snellen chart are different. The smaller the acuity, the more letters on the line.
Suitability:
All patients who are able to say or match their letters
Examination:
Patient is sat 6m away from the chart
Their eye is occluded to test the vision monocularly
The examiner asks the patient to read the lowest line that is clearest for them
Testing is continued until the patient is unable to complete a line
The level of vision is the lowest level the patient can correctly identify the letters
Repeat for the second eye
Summary
There are many ways to test visual acuity in children, and as an Orthoptist it is your job to gauge what would be the best choice for your patient. We have created a downloadable PDF of this post, along with photos of each test. Please click here to download.